Friday, October 9, 2020

Nifty 50 Profit-to-Earning ratio and its sentiment


VALUATION

NIFTY 50 PE RATIO RANGE

DESCRIPTION/MEANING

VERY EXPENSIVE

25 TO 30+

RARE EVENT. LOOK FOR SHORT OPPORTUNITIES, EXTREMELY SELL SUGGESTED

EXPENSIVE

20 TO 25

BOOK AT LEAST 60-75 % PROFIT BY SELLING YOUR PORTFOLIO

AVERAGE/MODERATE

15 TO 20

BUY OF GOOD LEVELS AND/OR HOLD (IF ALREADY BOUGHT)

INEXPENSIVE

12 TO 15

EXTREMELY BUY

VERY INEXPENSIVE

BELOW 12

RAREST EVENT. BUY, BUY, BUY


Continuation pattern using symmetrical triangles on stock/equity chart


 A symmetrical triangle is formed of higher lows and lower highs which usually signals that the market is balanced and ready to move in either direction. As the triangle is being formed, the volume shrinks, and the breakout would be accompanied with great volume which lead the market to the next movement. Refer this for more information: Chart patterns in technical analysis of stocks/equity

Four phases of stock market

Accumulation: If there is long duration of consolidation after declining, then market will upward movement.

Advancing: The upward movement can be determined by Elliot wave, also.

Distribution: If there is long consolidation after up move then the market is exhausted, then you will see downward move very quick.

Declining: The downward movement which can be determined by Elliot wave.
 

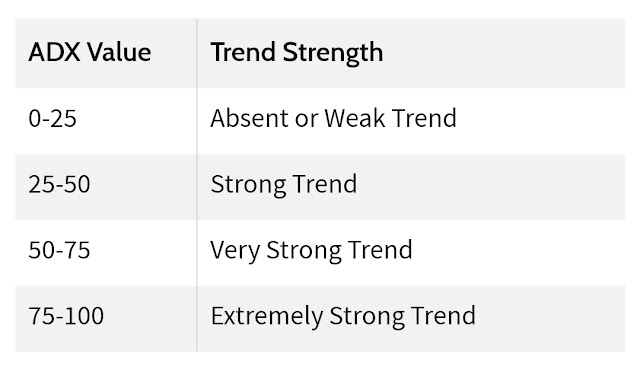
Absolute Directional Index/ADX signal strength

For 0-25: The ADX signal is quite weak or there is no trend upward/downward. Means market is sideways.

For 25-50: ADX signal is little stronger than above. Trend is strong whether it is downward or upwards.

For 50-75: ADX signal is very stronger. Trend is very strong either downward or upwards.

For 75-100: Extremely strong, very rare to see.
 

Thursday, October 8, 2020

Operator movement in stocks/equity

SN

BUY

SELL

TRADED VOLUME

INTERPRETATION

SENTIMENT

1

INCREASE

NO CHANGE

NO CHANGE

NOTHING

FLAT

2

NO CHANGE

INCREASE

NO CHANGE

NOTHING

FLAT

3

NO CHANGE

DECREASE

INCREASE (GREEN)

OPERATOR(BUY)

BULLISH

4

DECREASE

NO CHANGE

INCREASE (RED)

OPERATOR(SELL)

BEARISH


Tuesday, October 6, 2020

Stocks with highest dividend yield for 2020

The dividend yield, represented as in percent; it is a financial ratio (dividend/price) that shows how much a stock/equity of a company pays you the dividend a year relative to its stock price. The reverse of dividend yield is the price/dividend ratio.


Few more:


ITC:
Bajaj Auto:
Tech Mahindra:
GAIL:

Monday, October 5, 2020

Chart patterns in technical analysis of stocks/equity

BULLISH PATTERNS:
1. Flag
2. Pennant
3. Cup with handle (Tea cup pattern)
4. Ascending triangle
5. Symmetrical triangle
6. Measured move up
7. Ascending scallop
8. Three rising valleys

BEARISH PATTERNS:
1. Flag
2. Pennant
3. Inverted cup with handle (inverted tea cup pattern)
4. Descending triangle
5. Symmetrical triangle
6. Measured move down
7. Descending Scallop
8. Three descending peaks

REVERSAL PATTERNS:
1. Double Bottoms ("W" pattern)
2. Diamond Bottoms
3. Rectangle Tops
4. Head and shoulders Top
5. Double Tops (Inverted "W" pattern)
6. Diamond Tops
7. Rectangle Bottoms
8. Head and shoulders Bottoms


Higher high and higher low
 
 
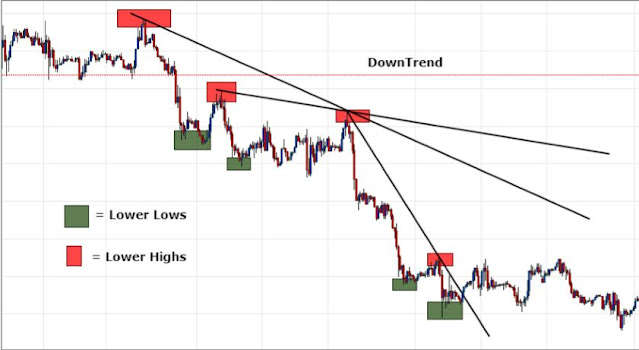
Lower Low and Lower High


Explore this blog